I was charged by the company I work for to add a code editor to our IronPython Application scripting engine. Originally the code editor was supposed to just be a friendly IDE.. but I wanted break points too. PythonStudio seemed like a good choice since it ships as a standalone application and can do Python breakpoints via our friend "the red dot" for break points.
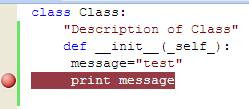
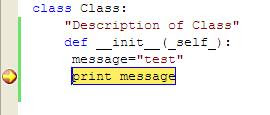
Here is how it all goes together. First I created a class library in PythonStudio. I set a break point in PythonStudio so that my source looks like this.
The next thing I did was build a simple PythonEngine host in C#.
static void Main(string[] args)
{
EngineOptions eo = new EngineOptions();
eo.ClrDebuggingEnabled = true; //this is important! this turns on debugging!
PythonEngine pe = new PythonEngine(eo);
//create the class def from our code base
pe.ExecuteFile(@"D:\Michael\My Documents\IronPython Studio\ClassLibrary1\ClassLibrary1\Class.py");
pe.Import("System");
pe.Import("System.Diagnostics");
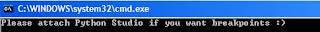
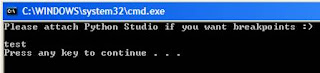
Console.WriteLine("Please attach Python Studio if you want breakpoints :)");
Console.ReadLine();
pe.ExecuteToConsole("a=Class()");
}
You can see that I execute the python file from the directory that iron python studio placed its file. If you run this file in or out of debugging nothing happens. Why? Visual Studio doesn’t know about the breakpoints in your iron python studio project yet.
The final piece is attaching PythonStudio to the c# application where the python engine lives. To do this run the application without debugging.
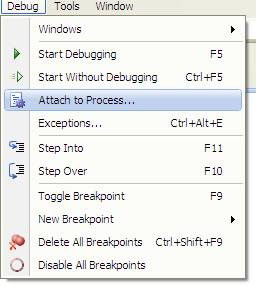
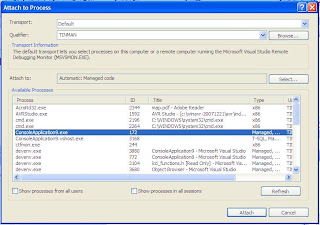
Then in PythonStudio Attach PythonStudio to your c# application.
As you can see my project was called ConsoleApplication9.exe [Don’t we all love the visual studio generated project names]
Hit Enter in the command window once you have attached PythonStudio and watch your break point get hit!
Hit F5 and this will be your final output.
As you can see *most* of the work is done for you. All that is needed is delicate wiring of pieces and parts. Finally a way for us all to embed scripting that is more powerful than VBA and has a better editor than VBA.
3 comments:
Michael, Instead of the manual step of attaching the debugger to the process, you could write this in the C# code - System.Diagnostics.Debugger.Break(). When the code runs it throws up a user-defined breapoint and the dialog to start a VS instance.
I'm writing a visual studio addin that launches our application and attaches it to visual studio automatically. Pretty simple piece of code to be honest with you... Read the ini file.. start the process.. access vs debugger and attach. That way you dont have to back inject code when running on a release mode client. If they dont have a pythonproject suo breakpoint file then they wont get breakpoints :)
Good news! IronPython 2.0 team has agreed to keep the codedom generator in 2.0! So Minor porting of this example and codedom for IronPython will exist!
Post a Comment